 PickVids
Best Data visualization & information design Videos
The 53 Data visualization & information design videos here were recommended by different people across different months. Choose by who it is for: 1 introductory, 8 intermediate, 44 for a general viewer, and 0 for someone who wants the harder derivation. Most of them are a talk. What they share is that one speaker finishes a claim, and the examples exist to hold that claim up. Channels you will keep seeing include TED, Colin McDonnell, Enthought.

A Better Default Colormap for Matplotlib | SciPy 2015 | Nathaniel Smith and Stéfan van der Walt
SciPy 2015 talk by Nathaniel Smith and Stefan van der Walt on choosing a new default colormap for Matplotlib.
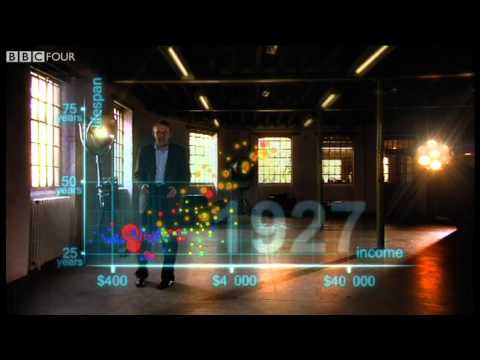
Hans Rosling's 200 Countries, 200 Years, 4 Minutes - The Joy of Stats - BBC
Hans Rosling uses augmented-reality animation to show 200 countries over 200 years in four minutes, built from 120,000 data points.

DON'T PANIC — Hans Rosling showing the facts about population
Hans Rosling uses data and animated statistics to show how world population is changing, why birth rates fall as child survival and wealth rise, and why population is expected to peak around 11 billion.
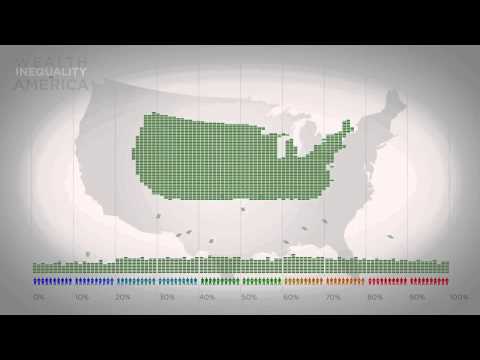
Wealth Inequality in America
A short infographic video on the distribution of wealth in America, contrasting what people believe, what they consider ideal, and the actual numbers.

Animations of unseeable biology | Drew Berry | TED
Drew Berry shows scientifically accurate animations of molecular processes inside cells, such as DNA replication, at TEDxSydney.

Immigration, World Poverty and Gumballs
Roy Beck's short gumball presentation using World Bank and Census data to argue that letting people immigrate to the US cannot solve world poverty because the numbers are so large.

How not to be ignorant about the world | Hans and Ola Rosling
Hans Rosling and his son Ola run an audience quiz with global population, health and income data to show how wrong most people are about the world.
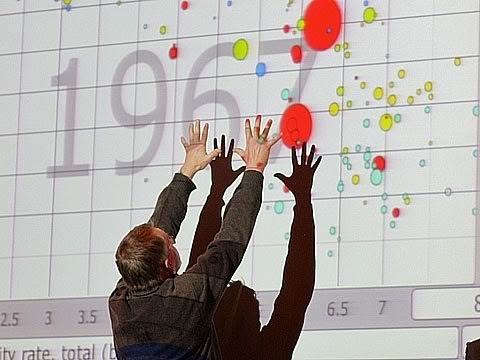
The best stats you've ever seen | Hans Rosling
Hans Rosling uses the Gapminder animated-data tool to debunk myths about world development, with sportscaster-like energy.

4 2 1 Christopher Domas The future of RE Dynamic Binary Visualization
Christopher Domas presents his Cantor Dust tool at Derbycon 2012, a 3D visual approach to reverse engineering binaries by visualizing their structure dynamically.

Simulating an epidemic
3Blue1Brown builds toy SIR models to simulate how an epidemic spreads and tests scenarios like social distancing, travel restrictions, central gathering places and quarantine.
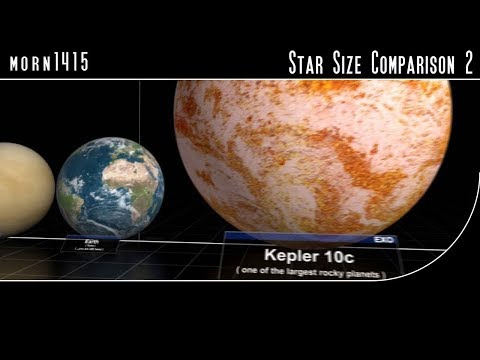
Star Size Comparison 2
A visual scale comparison of stars and cosmic objects, from planets up to some of the largest known stars, set to music.

Animated Voting Methods
An animated simulation comparing single-winner voting methods such as plurality, instant runoff and STAR.
Overpopulation – The Human Explosion Explained
A Kurzgesagt explainer on why the human population exploded and why growth is slowing, drawing on Our World in Data.

Religions and babies | Hans Rosling
Hans Rosling's TEDxSummit talk asks whether some religions have higher birth rates and how that affects population growth.

Flying Dream
Gary Garrett's stop-motion animation of his song Flying Dream, with notes arranged on a lattice of fifths and major thirds.
Why the world population won’t exceed 11 billion | Hans Rosling | TGS.ORG
Hans Rosling uses population statistics to explain why the world population will level off rather than grow without limit.

Hans Rosling: Debunking third-world myths with the best stats you've ever seen
In this TED talk, Hans Rosling uses animated statistics to debunk myths about the developing world, showing how health and income have improved across countries.
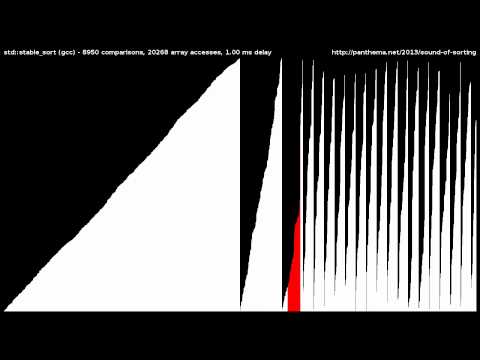
15 Sorting Algorithms in 6 Minutes
A visualization and sonification of 15 sorting algorithms, from selection sort to bogo sort, run on shuffled integers in six minutes.

Bret Victor - Media for Thinking the Unthinkable
Bret Victor's 2013 MIT Media Lab talk argues that the media we think with determine which thoughts are possible.

REcon 2013 - The Future of RE : Dynamic Binary Visualization (Christopher Domas)
Christopher Domas's REcon 2013 talk on dynamic binary visualization for reverse engineering.

Bret Victor - Drawing Dynamic Visualizations
Bret Victor's talk on Drawing Dynamic Visualizations.
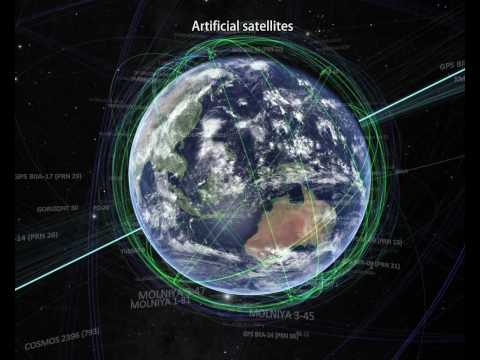
The Known Universe by AMNH #datavisualization
The American Museum of Natural History's film flies from the Himalayas out through the atmosphere and solar system to the afterglow of the Big Bang, using its Digital Universe Atlas four-dimensional map.

The Fallen of World War II
Neil Halloran's animated, data-driven documentary visualizes the human cost of World War II and compares it with other wars and the trend toward fewer war deaths in recent decades.

I Solved Klotski
2swap explains how he solved the Klotski sliding-block puzzle by mapping its full state space as a graph and visualizing it.