 PickVids
Best Data science & statistics Videos
The 56 Data science & statistics videos here were recommended by different people across different months. Choose by who it is for: 9 introductory, 12 intermediate, 32 for a general viewer, and 3 for someone who wants the harder derivation. Most of them are a talk. What they share is that one speaker finishes a claim, and the examples exist to hold that claim up. Channels you will keep seeing include Veritasium, Enthought, Stand-up Maths.

A Better Default Colormap for Matplotlib | SciPy 2015 | Nathaniel Smith and Stéfan van der Walt
SciPy 2015 talk by Nathaniel Smith and Stefan van der Walt on choosing a new default colormap for Matplotlib.

DON'T PANIC — Hans Rosling showing the facts about population
Hans Rosling uses data and animated statistics to show how world population is changing, why birth rates fall as child survival and wealth rise, and why population is expected to peak around 11 billion.
Is Most Published Research Wrong?
Veritasium explains why a large share of published research findings may be false, covering p-values, p-hacking, publication bias and low replication rates.

How not to be ignorant about the world | Hans and Ola Rosling
Hans Rosling and his son Ola run an audience quiz with global population, health and income data to show how wrong most people are about the world.

I don't like notebooks.- Joel Grus (Allen Institute for Artificial Intelligence)
Joel Grus's JupyterCon talk explaining why he dislikes Jupyter notebooks.

VisiData Lightning Demo at PyCascades 2018
A five-minute lightning demo of VisiData, a terminal tool for exploring and manipulating data.

Emacs + org-mode + python in reproducible research; SciPy 2013 Presentation
John Kitchin shows how Emacs org-mode with Python lets researchers combine narrative, math, figures and executable code in one document.

I Like Notebooks
Jeremy Howard defends Jupyter notebooks as a serious development environment, especially when paired with nbdev.

Interactive notebooks ~ Pluto.jl | Fons van der Plas | JuliaCon 2020
Fons van der Plas introduces Pluto.jl, a reactive notebook for Julia that tracks references between cells and re-runs affected cells when code changes.

You Suck at Excel - Joel Spolsky (Reupload)
A reupload of Joel Spolsky's talk teaching spreadsheet users the Excel features they are probably missing, such as keyboard navigation, named ranges, tables and lookups.

Michael Stonebraker | Big Data is (at least) Four Different Problems
Database pioneer Michael Stonebraker argues that 'big data' is really at least four different problems: big volumes with small analytics, big analytics, velocity, and variety.

Special Topics - The Kalman Filter (1 of 55) What is a Kalman Filter?
The first video in a 55-part series by Michel van Biezen that introduces the Kalman filter and builds from the rationale through algebraic examples to the full matrix treatment.

Breakout Session Presented by Dan Robinson of Heap at PGConf Silicon Valley 2015
Dan Robinson, then CTO of Heap, explains how Heap runs its product analytics backend on PostgreSQL and CitusDB.

Democrats Need to Face Why Trump Won | The Ezra Klein Show
Ezra Klein interviews Democratic pollster David Shor, who walks through survey data and charts explaining the 2024 election results.

Keynote: Begin...End?
David Beazley's PyData Global 2021 keynote, an oral history of early scientific Python.

36C3 - BahnMining - Pünktlichkeit ist eine Zier - english translation
David Kriesel's 36C3 talk, in an English translation, analyzes a year of scraped Deutsche Bahn data covering every stop of every long-distance train in Germany.

Leading Questions - Yes Prime Minister
A clip from Yes Prime Minister in which Sir Humphrey shows how leading questions can make a survey support or oppose national service.

Social Physics: How Good Ideas Spread | Sandy Pentland | Talks at Google
Sandy Pentland of MIT presents his book on social physics, which uses big-data studies of how people interact to explain how ideas spread.

Hans Rosling: Debunking third-world myths with the best stats you've ever seen
In this TED talk, Hans Rosling uses animated statistics to debunk myths about the developing world, showing how health and income have improved across countries.

KEYNOTE / Robert Erdmann
Robert Erdmann, a materials scientist at the Rijksmuseum, gives a PyCon keynote on the ultra-high-resolution imaging of Rembrandt's Night Watch.
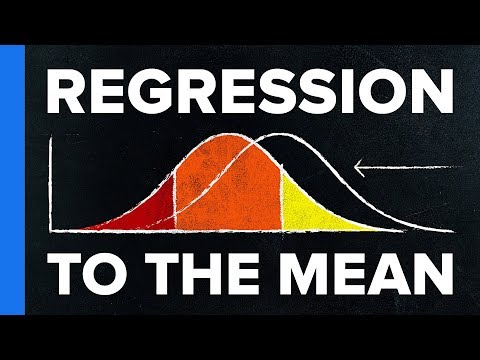
How We’re Fooled By Statistics
A short Veritasium video explaining regression to the mean and how ignoring it leads to wrong conclusions about punishment versus reward, medical treatments and sports streaks.

John Rauser keynote: "Statistics Without the Agonizing Pain" -- Strata + Hadoop 2014
John Rauser's Strata 2014 keynote argues that programmers can learn statistics quickly by simulating random processes and shuffling data.

DuckDB – The SQLite for Analytics (Mark Raasveldt, CWI)
Mark Raasveldt of CWI presents DuckDB, an embeddable analytical database described as the SQLite for analytics, in a CMU Database Group talk.

What 40,000 Videos Tell Us About The Trending Tab
Coffee Break analyzes about 40,000 videos from seven months of YouTube's trending tab.